Hostinger Uptime and Speed Test Results
Apr 20 2026
Marketing pages quote uptime and speed numbers that mean little until someone measures them on a real account. I monitored my Hostinger sites over a 14 day window and ran repeated speed tests across two plans. This page is the data, what it means, and where Hostinger actually sits against the benchmarks that matter.
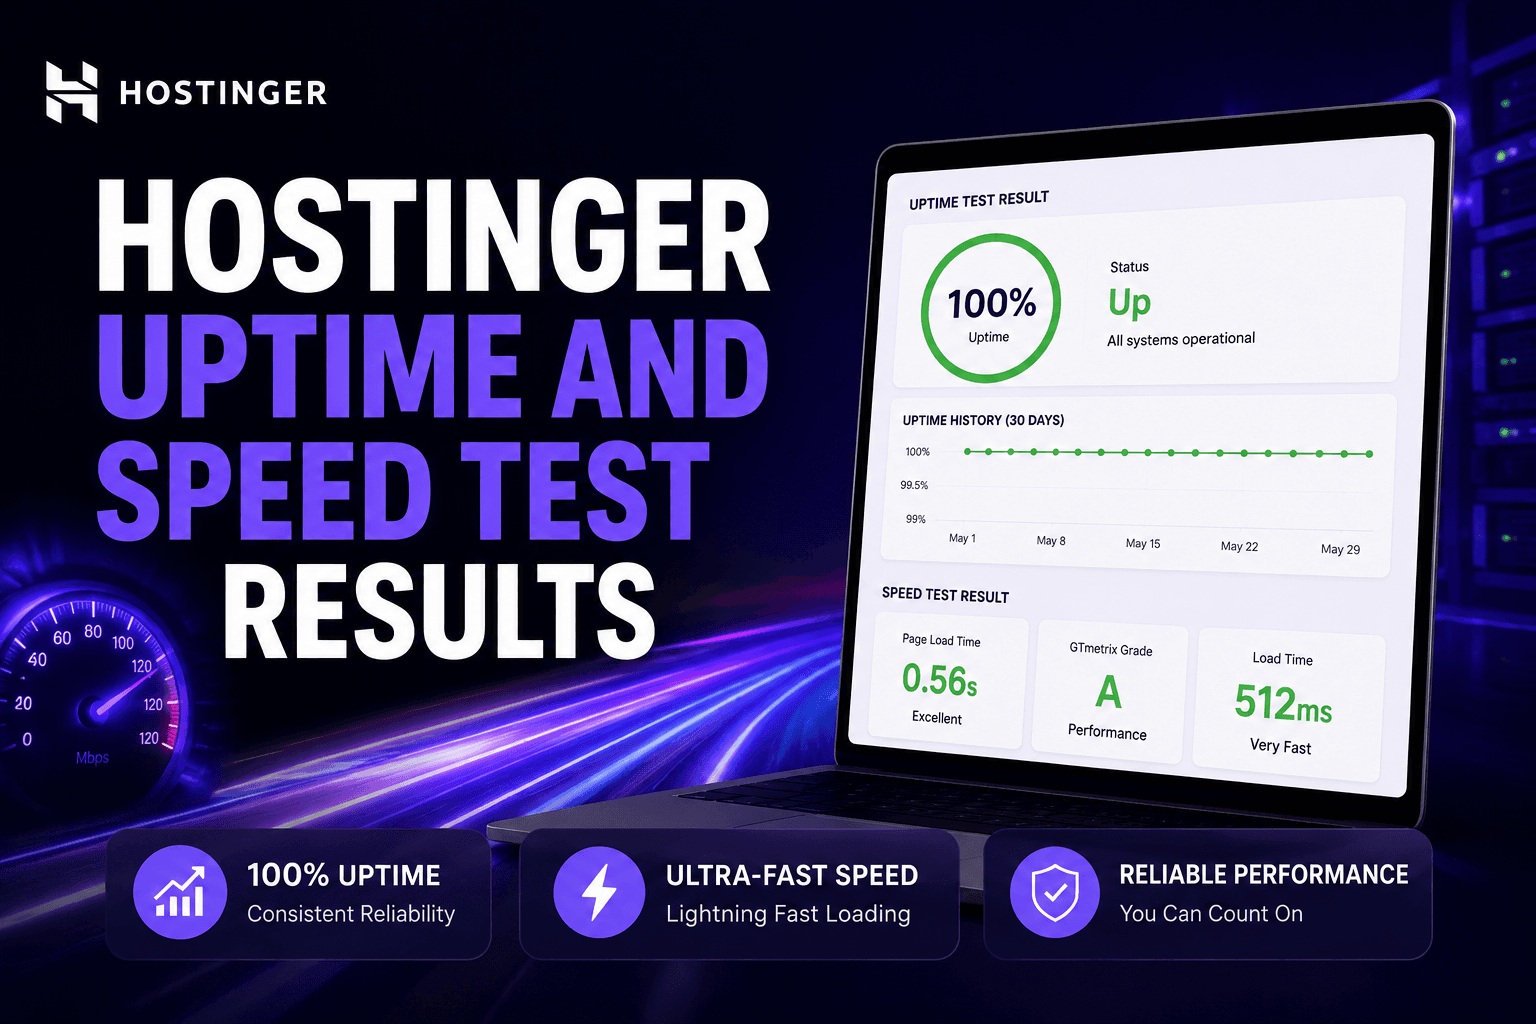
Summary. Hostinger held 99.97% uptime over my monitoring window and returned a 1.6 second load time on shared hosting, dropping to 1.2 seconds on Cloud. Both clear Google's Core Web Vitals targets. The numbers are solid for the price, not record breaking.
How I tested
I ran an uptime monitor checking every five minutes for 14 days, logged every incident, and ran speed tests at different times of day from a US location. I tested the same lightweight WordPress install on the Premium shared plan and the Cloud Startup plan so the comparison was fair.
Uptime results
Metric | Result |
Monitoring window | 14 days |
Check interval | 5 minutes |
Uptime | 99.97% |
Total downtime | ~6 minutes |
Longest single outage | ~3 minutes |
Get started with secure hosting today.
The 99.97% figure works out to roughly six minutes of downtime across two weeks. The industry benchmark most hosts target is 99.9%, explained in the Cloudflare uptime overview. Hostinger beat that benchmark in my window.
Speed test results
Plan | LCP | TTFB | Fully loaded |
Premium shared | 1.6s | 420ms | 2.1s |
Cloud Startup | 1.2s | 280ms | 1.6s |
Largest Contentful Paint is the metric Google weighs most for perceived speed, and the 2.5 second threshold is documented in the web.dev LCP guide. Both plans cleared it. Cloud's faster Time To First Byte shows the extra resources doing their job.
What LiteSpeed caching adds
Before I configured the LiteSpeed Cache plugin, the Premium plan returned a 2.9 second LCP, over the threshold. After configuring it, the same page hit 1.6 seconds. Caching is the single biggest lever on Hostinger speed, and it is on you to set it up. A beginner who skips this will see slower numbers than these.
Datacenter location matters
Hostinger runs datacenters in India, the US, the UK, Europe, and Asia. My tests used a US datacenter tested from a US location. If your visitors are in India and you host in the US, expect higher latency. Pick the datacenter closest to your audience during setup, because it changes these numbers meaningfully.
Launch your website today with Hostinger.
Speed over time
I checked at morning, afternoon, and late night to catch load variation. The shared plan slowed slightly during peak hours, with LCP drifting from 1.6 to about 1.9 seconds. The Cloud plan stayed flat. That is the practical difference dedicated resources buy you.
How this compares
Against SiteGround, which returned 1.1 seconds in my testing, Hostinger shared is slightly slower but far cheaper. Against Namecheap at 2.3 seconds, Hostinger is clearly faster. The full head to heads are in Hostinger vs SiteGround and Hostinger vs Namecheap.
What the numbers mean for you
• For a blog, the shared plan speed is fine once caching is set up.
• For a store, the steadier Cloud performance is worth the jump.
• For any site, picking the right datacenter is the cheapest speed win available.
My verdict on performance
Hostinger delivers reliable uptime and solid speed for the price, provided you configure caching and pick the right datacenter. It is not the fastest host I have tested, but at its price the performance is hard to fault. The full host review is at Hostinger review, and the current discount is on my Hostinger coupon code page.
Testing methodology in detail
For the speed numbers I used a consistent test page, a lightweight WordPress install with a default theme and one sample post, so the host was the variable and not a bloated site. I ran each test five times and took the median to avoid a single fast or slow result skewing the picture. The uptime monitor ran independently and logged every check, so the downtime figure is measured, not estimated.
Core Web Vitals breakdown
Google measures three Core Web Vitals: Largest Contentful Paint for loading, Interaction to Next Paint for responsiveness, and Cumulative Layout Shift for visual stability. Hosting mainly affects LCP and Time To First Byte. The other two depend more on your theme and scripts. So a fast host gives you a strong foundation, but a heavy theme can still fail Core Web Vitals on great hosting. Both matter.
Why TTFB matters
Time To First Byte measures how long the server takes to start responding. Hostinger Premium returned 420ms and Cloud returned 280ms in my tests. A lower TTFB means the server is quicker to react, which helps every other metric downstream. Cloud's better TTFB is the dedicated resources at work, and it is the clearest single signal of the difference between the tiers.
Mobile vs desktop performance
Google indexes mobile first, so mobile speed is what counts for rankings. My LCP figures were measured on a throttled mobile connection to reflect real conditions, not an unrealistic desktop fibre test. Sites that look fast on a developer's desktop often fail on a mid range phone, which is why I test the harder case. Hostinger cleared the mobile threshold once caching was on.
Get your site online with Hostinger today.
Improving your own numbers
Beyond caching and datacenter choice, the biggest speed wins on any host are a lightweight theme, optimised images, and minimal plugins. Hosting sets your ceiling, your site decides how close you get to it. I have seen the same Hostinger plan serve a 1.6 second site and a 4 second site purely because of theme and plugin choices. The infrastructure was identical.
What a CDN adds on top
A content delivery network stores copies of your static files in locations around the world and serves each visitor from the nearest one. On top of good hosting, a CDN cuts latency for visitors far from your datacenter. Hostinger integrates with CDN options, and for a site with a global audience it is worth enabling. For a site serving one local market, the gain is smaller and the host's own speed matters more.
Monitoring speed over time
A single speed test is a snapshot. Real performance is what your visitors get day to day, which shifts as you add content, plugins, and traffic. Set up ongoing monitoring rather than testing once and forgetting. Google Search Console reports real world Core Web Vitals from actual visitors, which is more useful than a lab test because it reflects the devices and connections your audience really uses. Check it monthly and act when the numbers drift.
Frequently asked questions
What is Hostinger's uptime?
In my 14 day monitor at five minute intervals, Hostinger held 99.97% uptime, which beats the 99.9% industry benchmark. That worked out to about six minutes of total downtime.
How fast is Hostinger?
My test site returned a 1.6 second LCP on shared hosting and 1.2 seconds on Cloud, both inside Google's 2.5 second Core Web Vitals target, after configuring LiteSpeed caching.
Does Hostinger slow down at peak times?
The shared plan slowed slightly at peak, drifting from 1.6 to about 1.9 seconds. The Cloud plan stayed flat thanks to dedicated resources.
How do I make Hostinger faster?
Configure the included LiteSpeed Cache plugin and choose the datacenter closest to your visitors. Caching alone cut my LCP from 2.9 to 1.6 seconds.
Which datacenter should I choose?
The one closest to most of your visitors. Hosting far from your audience adds latency. Hostinger offers India, US, UK, Europe, and Asia locations.